GUIDE
It will take you through signing up, creating a new project, entering Emotion Chart questions and viewing the results.
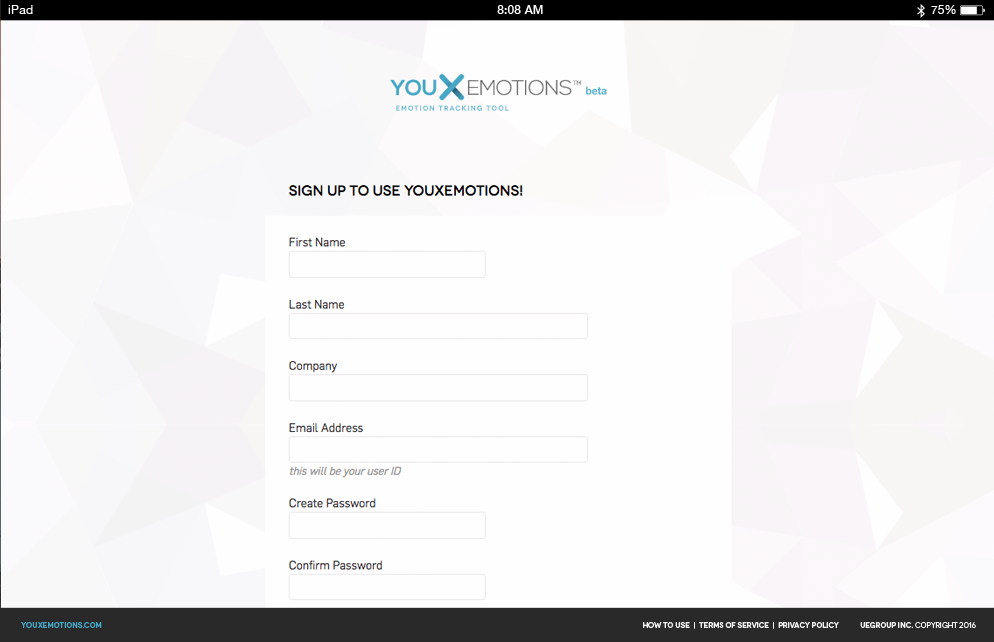
Sign up to create an account with youXemotions™.
youXemotions™ is optimized for Chrome or Safari
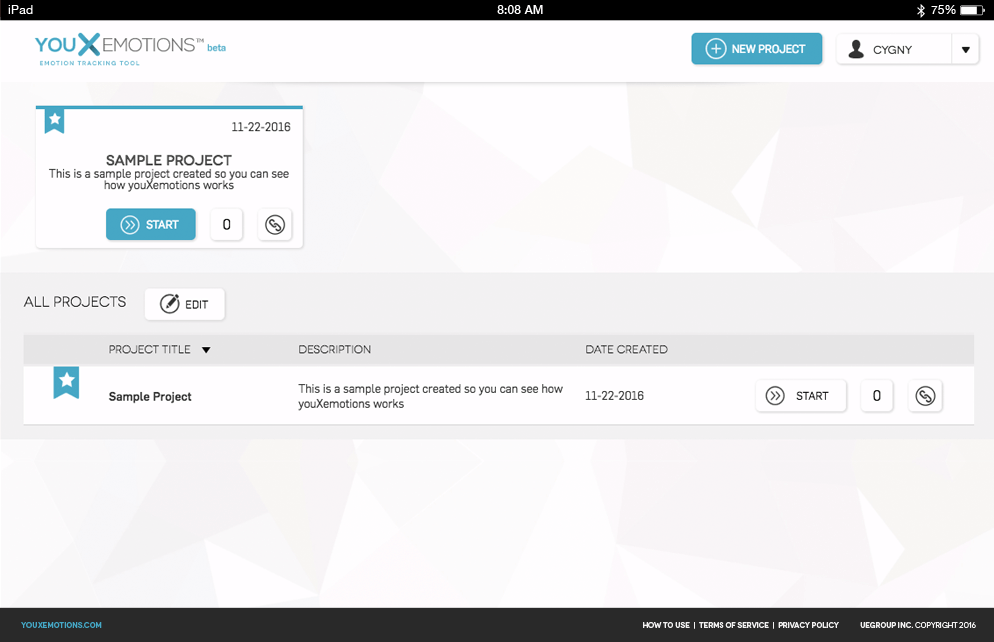
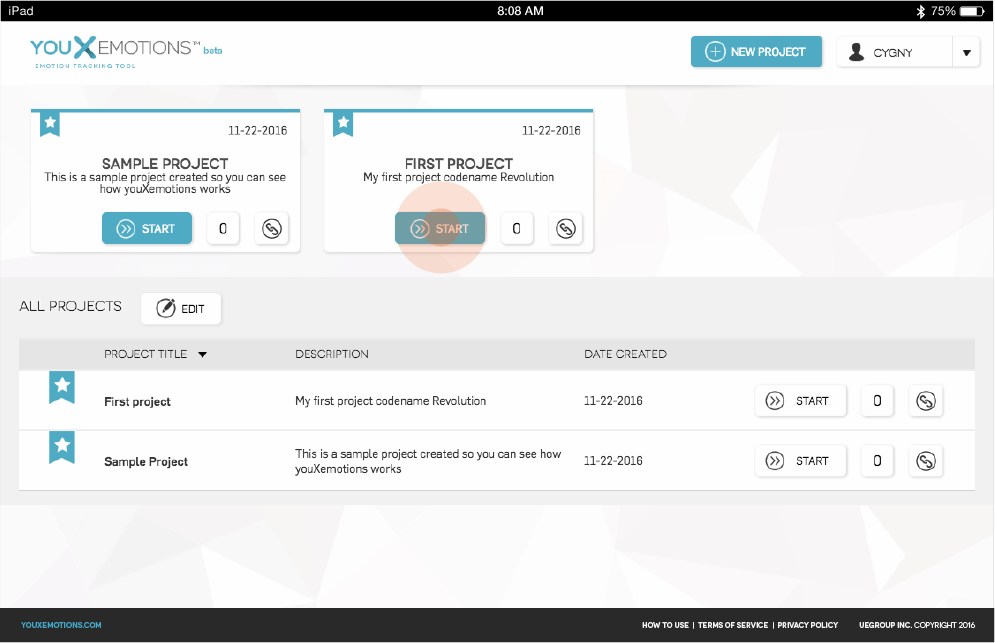
Once you sign up for an youXemotions™ account you are presented with your current list of projects. If this is your first time using youXemotions™ a sample project is the only entry. Select “New Project” to start a new project.
Create a title for your project and enter a description (optional). Select which Participant Information fields you want to ask your participant to enter before they start using the tool.
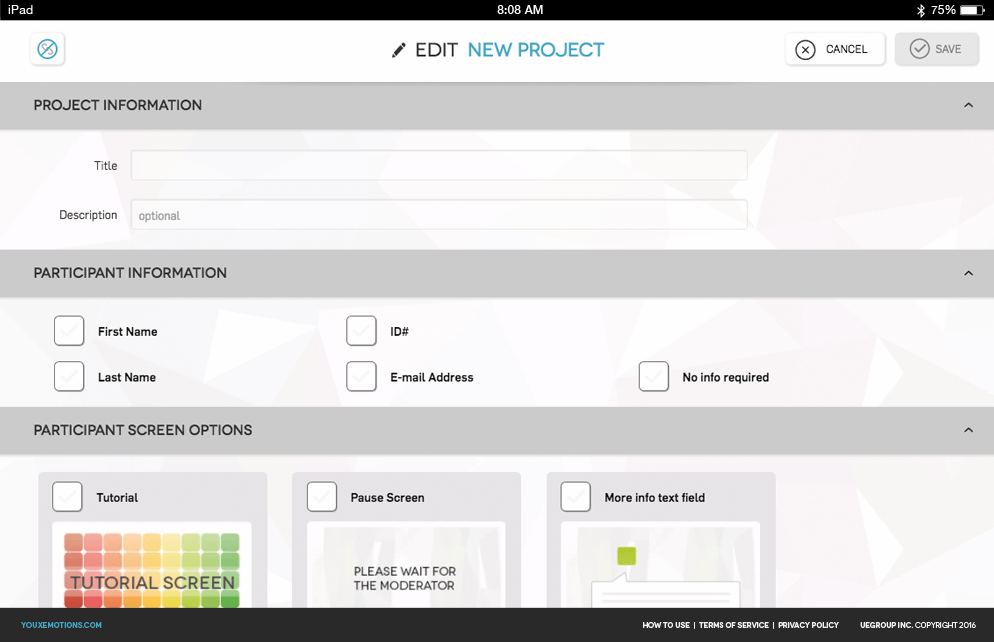
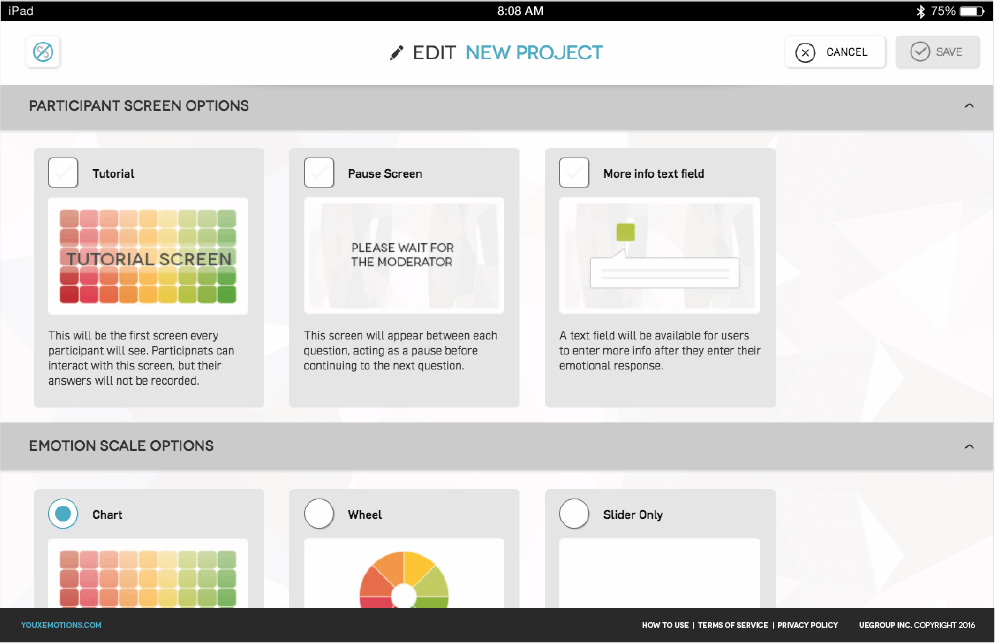
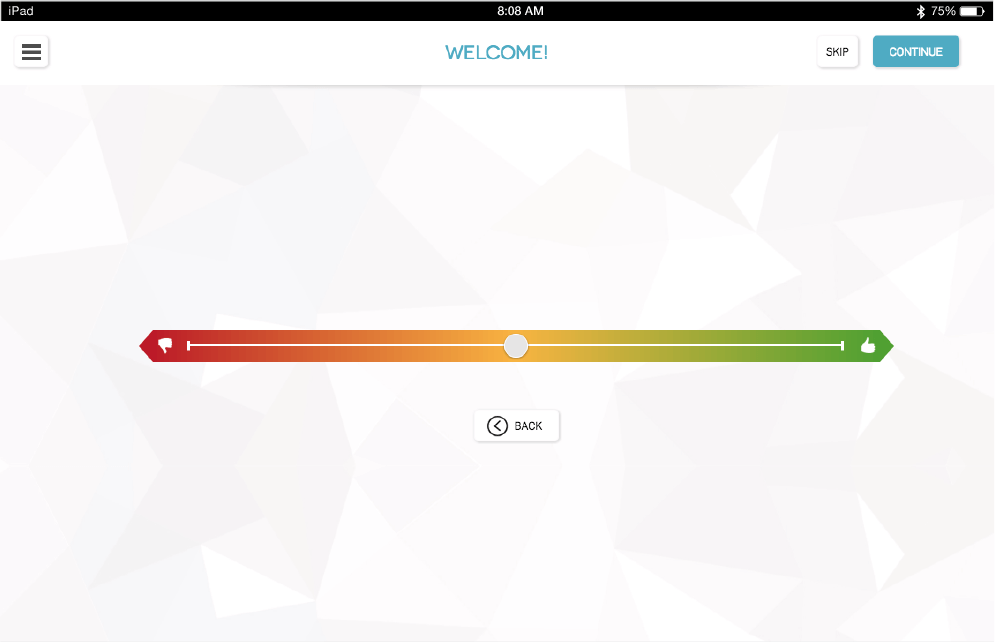
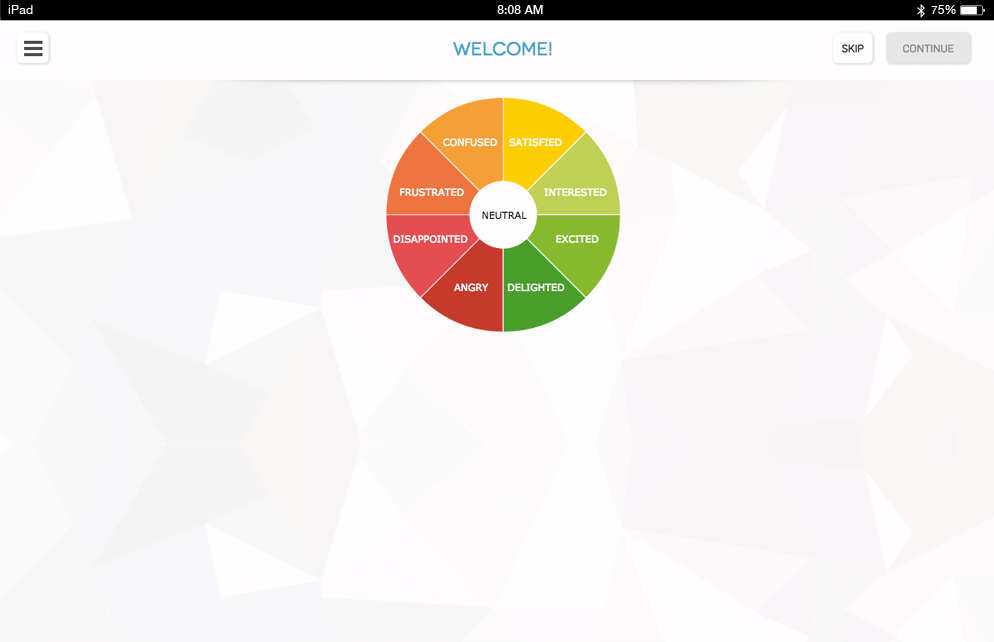
Tutorial screen, when selected, is the first screen every participant will see in order to familiarize them with your chosen Emotion Scale. Participants can interact with this screen, but their answers will not be recorded.
Pause screen would appear between each question, acting as a pause before continuing to the next question to give the moderator the opportunity to control the particpant’s progress through the moments.
More info text field provides the opportunity for a participant to enter more info in a text box after they enter their emotional response.
When setting up a project, you can choose which of the 3 emotion scales would best work for your study: Chart, Wheel, or Slider Only.
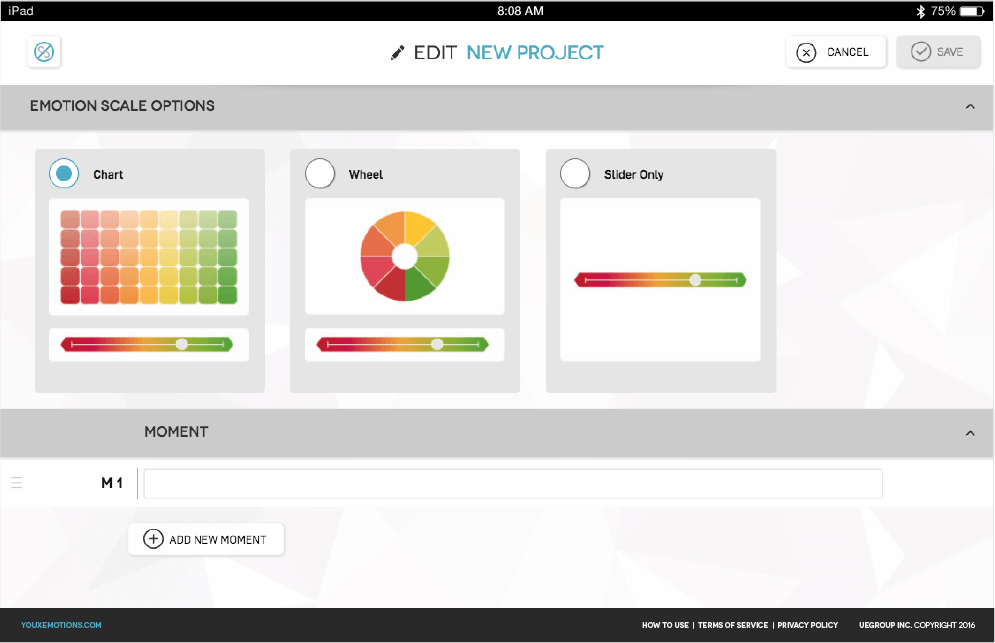
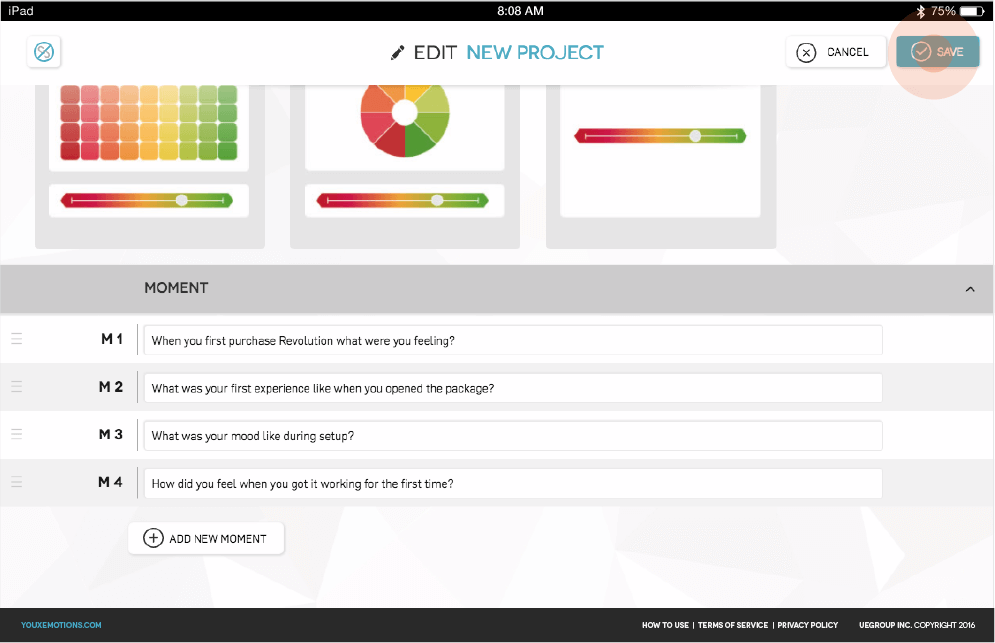
Enter your moment descriptions or questions as shown. Pressing “Return” on your keyboard will automatically create a placeholder for a new question. Alternately, you can select “Add New Question”.
When done entering questions, select “Save” to save the project. This action will also take you back to the Projects Screen.
Note: While the example shows questions you can query participants by entering “Moments in Time” spanning an experience with a product, such as a video game. In this case you could ask participants to select their mood during the following moments:
- • Looking at the game console package
- • Opening the package
- • Setting up the console
- • Playing the first game
Once you’ve entered at least one moment description or question, you can save your project. After you’ve saved, you can click the link icon at the top of the page to turn on or off a link to your entire project. You can hit Copy Link and send it to any of your participants and they can complete your project from this link on any device.
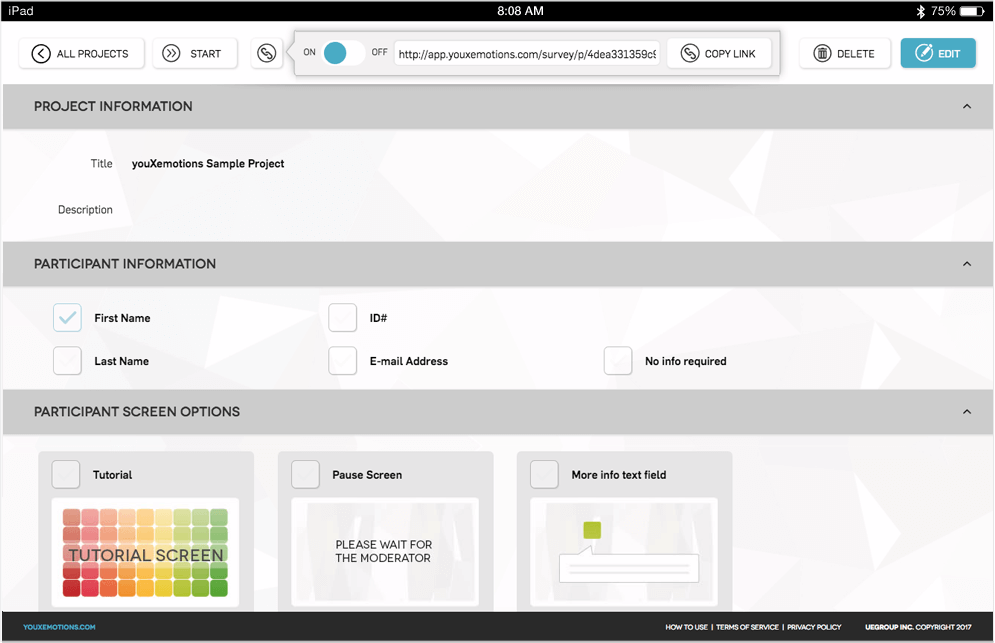
From this screen, you can initiate a session using the project you created by selecting “Start” on the respective project. If you “Favorite” your project, it will appear as a card above the “All Projects” list. You can also start a project from the project details page.
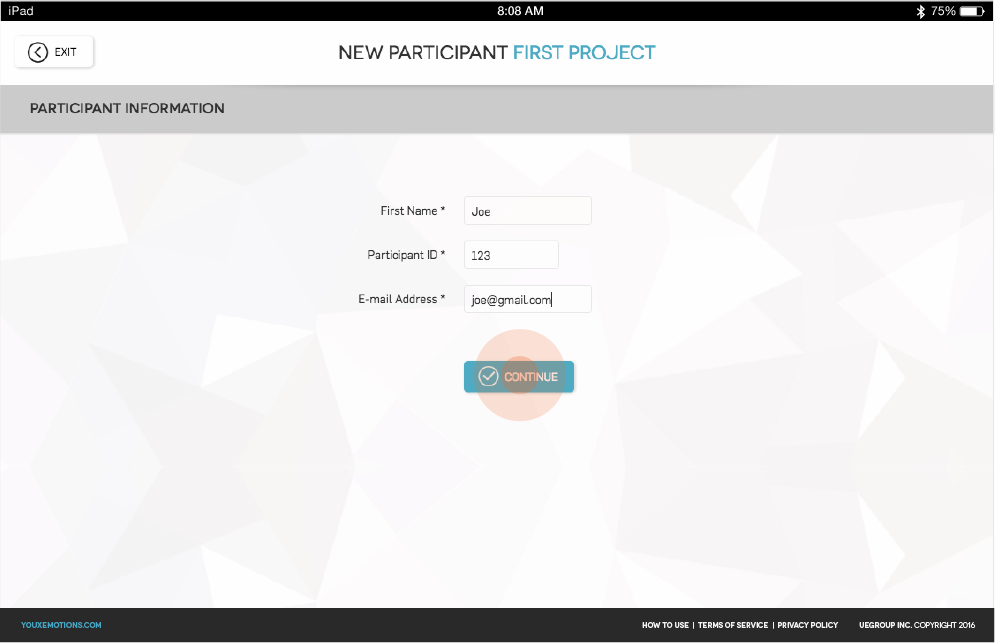
Now it’s time for the participant to enter whichever information fields you chose to include during project setup.
The participant reads the first moment description/question and reports his/her emotion using the Emotion Scale that was chosen during project setup.
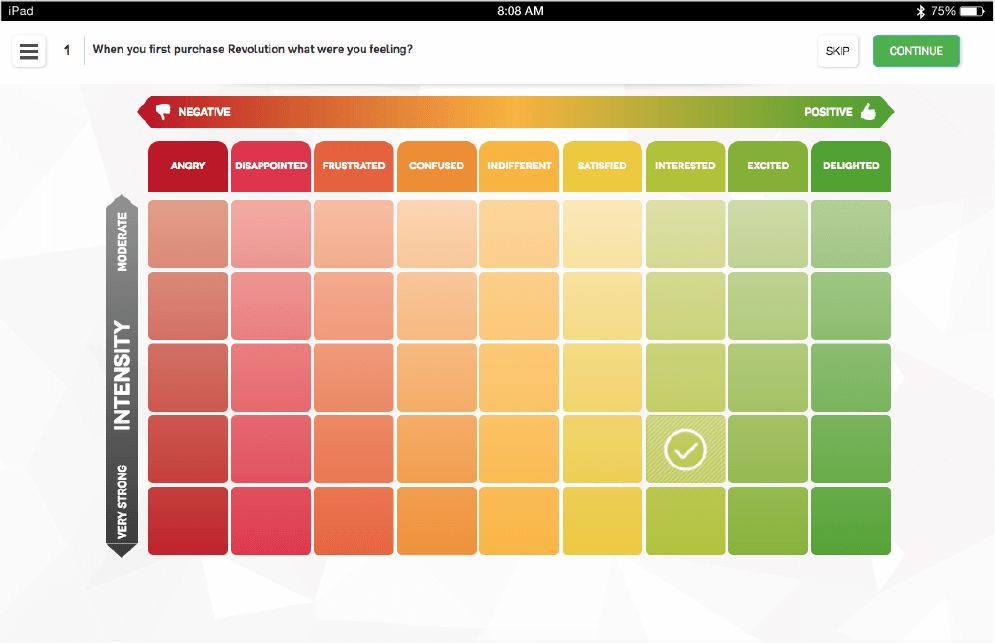
to Report Emotion
Here are examples of the alternate Emotion Scales in use. The horizontal slider allows for a more universal means to describe emotion while the wheel provides another way to visualize the positive to negative scale. All the scales do include the option to remove words and enter emotion using a slider.
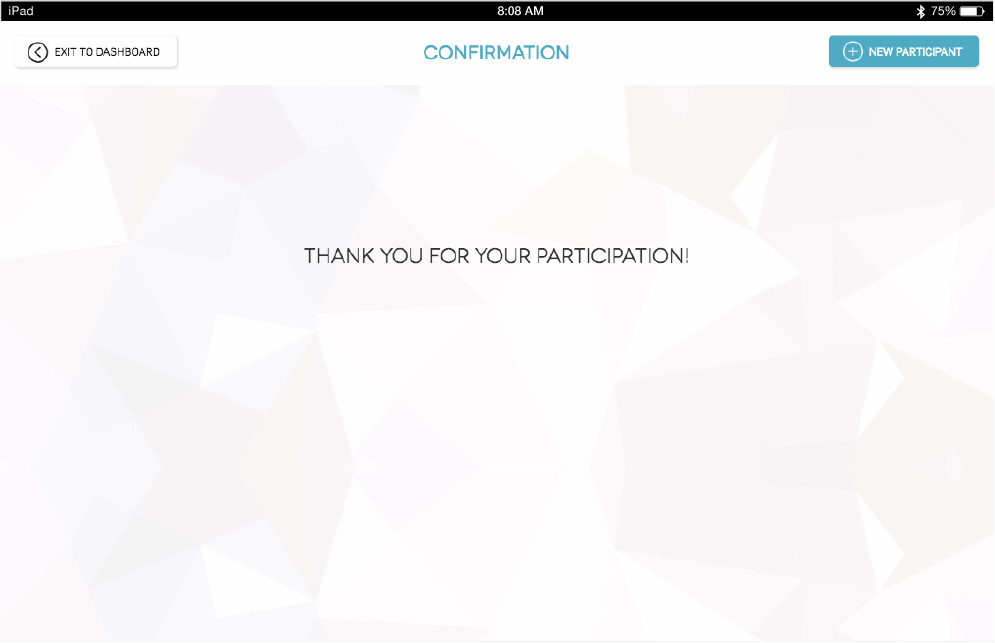
The moderator now has the option of starting a new session with a new participant or exiting to the dashboard to view the results.
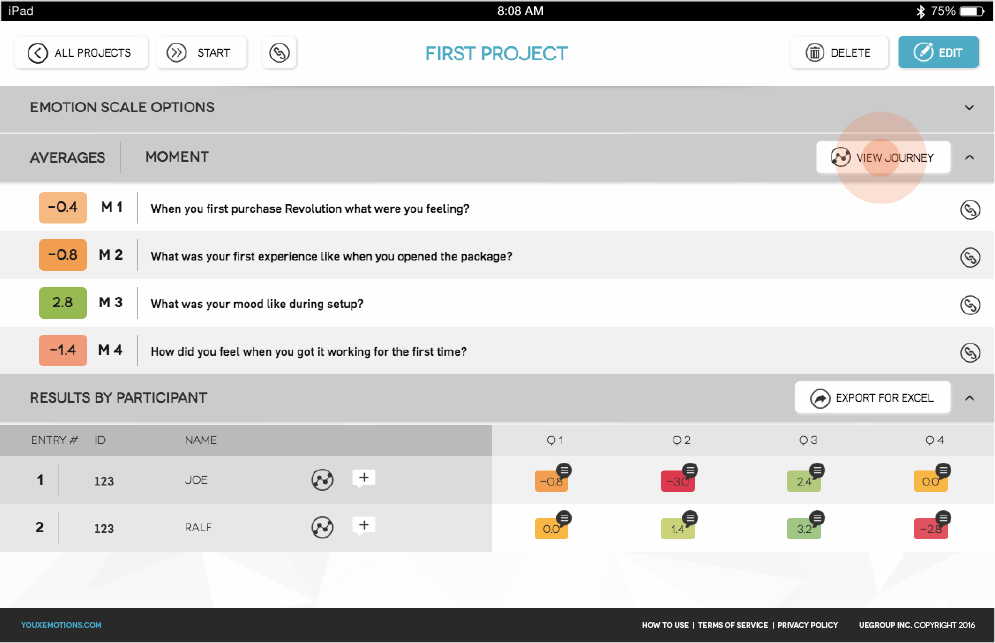
From the dashboard select First Project to view the results.
The results from a session are shown here. The Averages column shows the average value from all the participants for each moment / question. Selecting “View Chart” displays the Emotion Chart (see below).
The Results by Participant section provides results for each participant with the ability to view each participant’s Emotion Chart, add comments and view the numerical values with color coding for each emotion selection.
Export for Excel exports the numerical data as an Excel file.
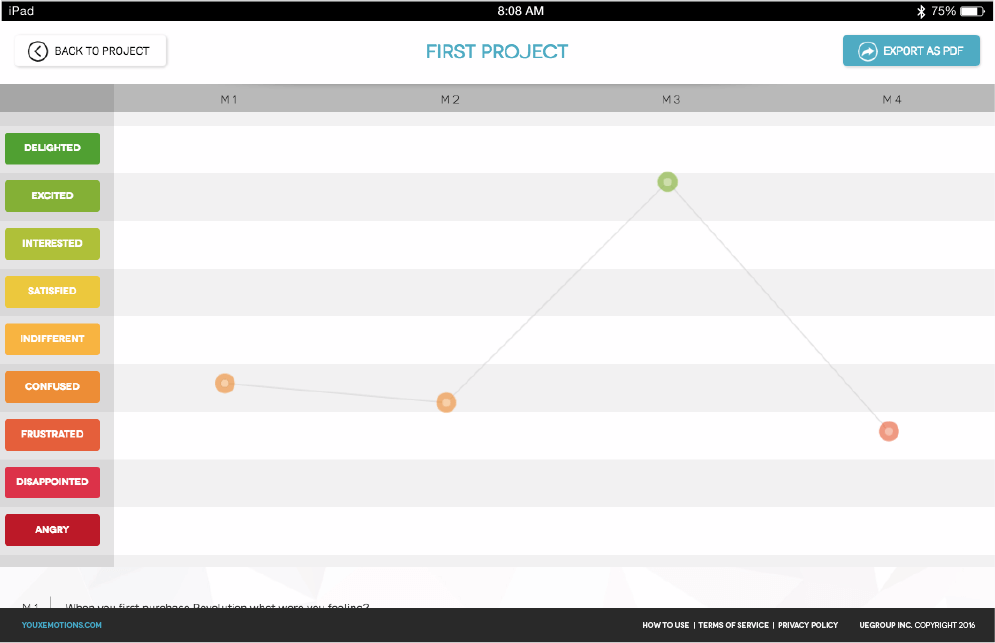
This chart displays the “emotional journey” of the participants using the averages of the emotion selections for each moment / question.
Selecting “Export as PDF” creates a PDF file of the chart.